Introduction: From Zero to Data Analyst (Using Just Excel)
If you’re searching for how to become a data analyst, you’ve probably seen overwhelming advice: learn Python, master SQL, build dashboards, and more.
That’s exactly where I got stuck.
I didn’t have a computer science degree. I wasn’t a math genius. And honestly, coding felt intimidating at first. But I had one tool already installed on my laptop—Excel.
What started as simple spreadsheet practice turned into a real skill… and eventually, a data analyst career path.
This is not a “perfect success story.” It’s a realistic guide—with struggles, mistakes, and practical steps that actually work.

Why Excel Is the Best Starting Point
Most beginners underestimate Excel. But in reality, it’s one of the most powerful tools in data analysis.
Here’s why Excel works:
- Beginner-friendly interface
- No coding required
- Widely used in companies
- Perfect for learning data fundamentals
According to industry insights from platforms like Harvard Business Review and LinkedIn Learning, Excel remains one of the top required skills for entry-level analysts.
My Starting Point (No Experience, Just Curiosity)
I started with almost nothing:
- No portfolio
- No technical background
- Basic computer knowledge
I just searched:
👉 “how to become a data analyst”
Most guides were too complex. So I simplified my path:
“Let’s master Excel first.”
Step-by-Step: How I Became a Data Analyst Using Excel
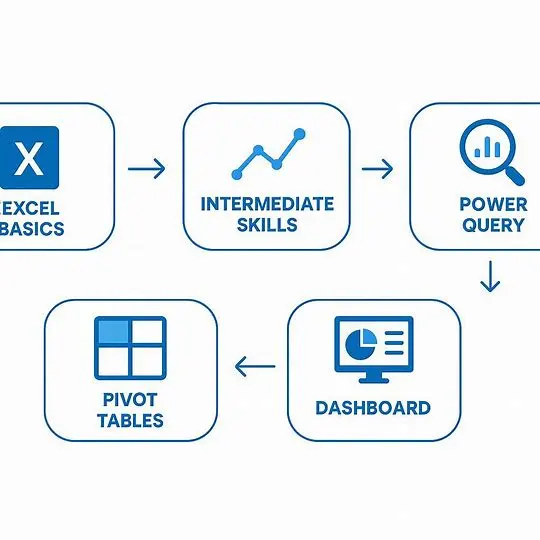
1. Learning Basic Excel (Foundation Stage)
At the start, I focused on:
- Data entry and formatting
- Basic formulas:
SUMAVERAGECOUNT
- Sorting and filtering
💡 Reality Check:
This stage feels boring—but it’s crucial. Without strong basics, advanced topics won’t make sense.
2. Moving to Intermediate Skills
Once I got comfortable, I leveled up:
- IF statements
- VLOOKUP / XLOOKUP
- Conditional formatting
- Data cleaning techniques
This is where things got interesting.
I started solving real-life problems, like:
- Cleaning messy data
- Matching records
- Creating simple reports
3. Discovering Power Tools (Game-Changer Phase)

This phase changed everything.
🔥 Power Query
- Clean messy datasets automatically
- Transform raw data into structured format
📊 Pivot Tables
- Analyze large datasets instantly
- Create summaries without formulas
📈 Charts & Dashboards
- Turn data into visual insights
💡 This is when I realized:
“I’m not just using Excel… I’m doing data analysis.”
Excel vs Other Data Analyst Tools
Here’s a realistic comparison beginners should understand:
| Tool | Difficulty | Use Case | Should You Learn First? |
|---|---|---|---|
| Excel | Easy | Data cleaning & analysis | ✅ YES |
| SQL | Medium | Database querying | Later |
| Python | Hard | Advanced analysis & automation | Later |
| Power BI | Medium | Dashboards & visualization | After Excel |
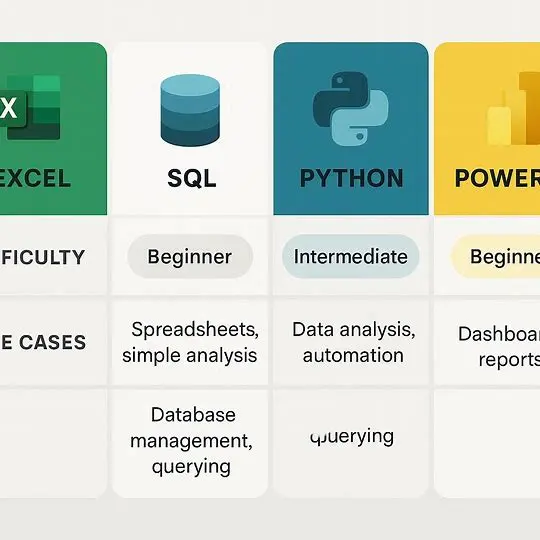
👉 Key Insight:
Excel builds your foundation. Other tools become easier afterward

How I Practiced (This Is What Actually Worked)
Learning theory wasn’t enough. Practice made the difference.
What I did daily:
- Downloaded random datasets (sales, students, etc.)
- Cleaned messy data
- Created reports
- Built dashboards
Example Practice Tasks:
- Fix wrong date formats
- Remove duplicates
- Analyze sales trends
- Create monthly reports
💡 Pro Tip:
Don’t just watch tutorials—do the work yourself.
Building My First Portfolio
At some point, I realized:
“Skills are useless if you can’t show them.”
So I created simple projects:
My portfolio included:
- Sales dashboard
- Data cleaning project
- Excel report with insights
You can upload your work on:
- Google Drive
- GitHub
- Personal website
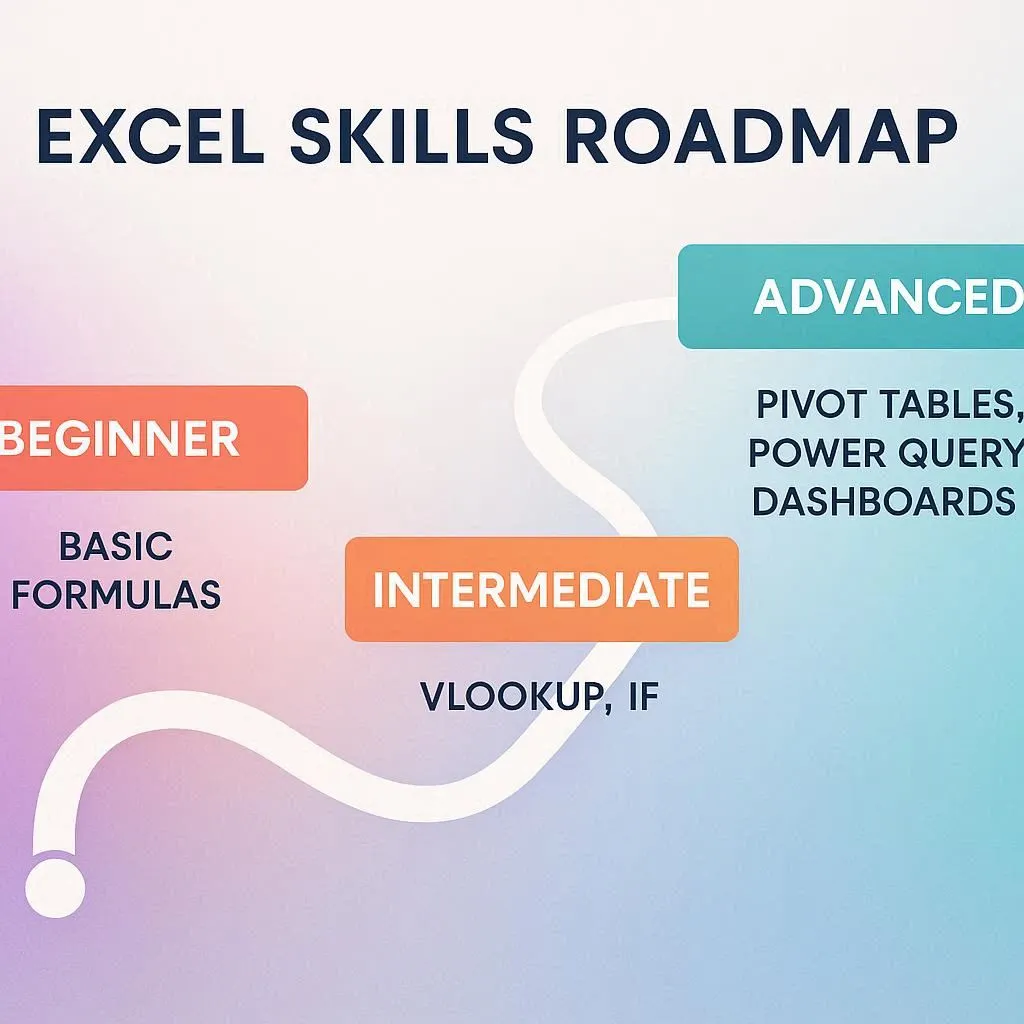
Key Skills You Must Learn in Excel
Here’s a focused roadmap:
🔹 Essential Skills
- Data cleaning
- Sorting & filtering
- Basic formulas
🔹 Intermediate Skills
- IF, VLOOKUP, INDEX-MATCH
- Conditional formatting
🔹 Advanced Skills
- Pivot Tables
- Power Query
- Dashboard creation
Common Mistakes I Made (Avoid These)
Let’s be real—this journey wasn’t smooth.
❌ Mistake 1: Watching Too Many Tutorials
👉 Fix: Practice more than you watch
❌ Mistake 2: Ignoring Data Cleaning
👉 Fix: Cleaning is 70% of real work
❌ Mistake 3: Not Building Projects
👉 Fix: Start small but start early
Realistic Timeline (No Fake Promises)
Here’s how long it realistically took me:
| Stage | Time Required |
|---|---|
| Basics | 2–3 weeks |
| Intermediate | 1–2 months |
| Advanced + Projects | 2–3 months |
👉 Total: 3–6 months (consistent effort)
How I Got My First Opportunity
I didn’t magically get hired.
Instead, I:
- Showed my Excel projects
- Helped others with data tasks
- Did small freelance gigs
Eventually, I started getting real work.
💡 Platforms you can try:
- Upwork
- Fiverr
Key Insights Most People Won’t Tell You
1. You Don’t Need to Learn Everything
Focus on practical skills, not perfection.
2. Excel Is Enough to Start
You can become a junior data analyst using Excel alone.
3. Consistency Beats Talent
1 hour daily > 10 hours once a week
Conclusion: Your Path Starts Today
If you’re serious about learning how to become a data analyst, don’t overcomplicate things.
Start with Excel.
Master the basics. Practice daily. Build projects. Stay consistent.
That’s it.
You don’t need expensive courses or advanced coding to begin.
You just need a laptop… and commitment.