Introduction
If you’re serious about becoming a data analyst, mastering excel basics for data analysis is your first real step.
And honestly, bro, most beginners make one mistake — they jump into advanced tools like Python or Power BI without understanding Excel properly. But here’s the truth:
👉 Excel is still one of the most powerful tools used by analysts worldwide.

From freelancers on Upwork to corporate analysts, Excel is everywhere.
In this guide, I’ll break down the top 5 Excel basics you absolutely must learn — not just theory, but practical insights based on real-world usage.
Why Excel Still Matters in Data Analysis (Quick Comparison)
Before we dive into the basics, let’s quickly understand where Excel stands compared to other tools:
| Tool | Best For | Difficulty | Usage Level |
|---|---|---|---|
| Excel | Data cleaning, quick analysis | Easy | Beginner to Advanced |
| Python | Automation, large datasets | Hard | Advanced |
| Power BI | Dashboards & visualization | Medium | Intermediate |
| SQL | Database querying | Medium | Intermediate |
👉 Key Insight:
Excel is the foundation. If your Excel is strong, learning other tools becomes 10x easier.
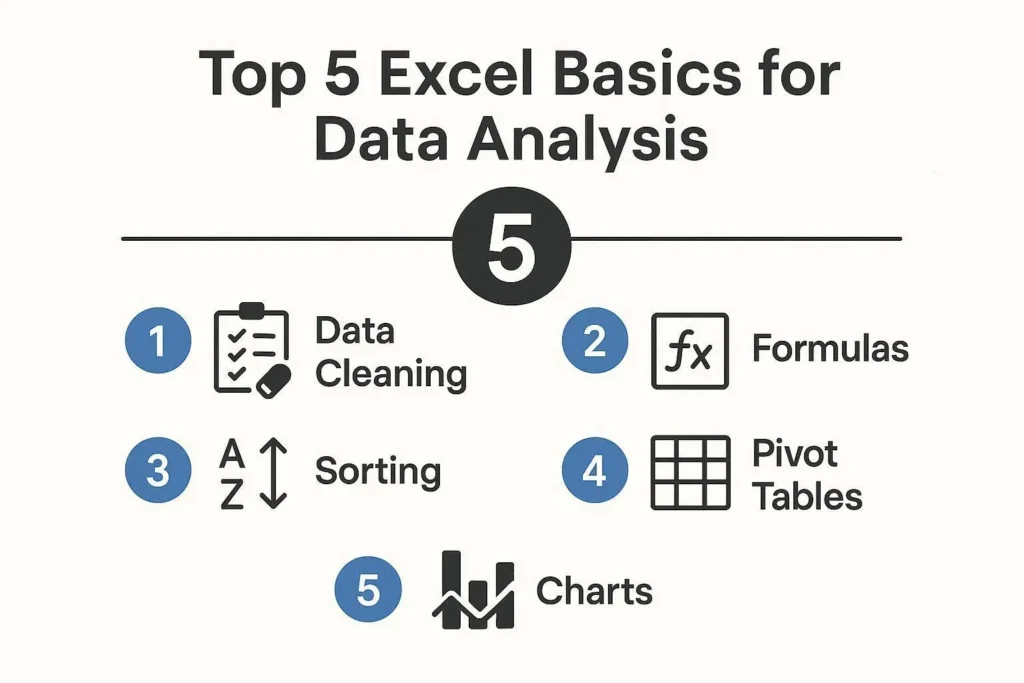
Top 5 Excel Basics for Data Analysis
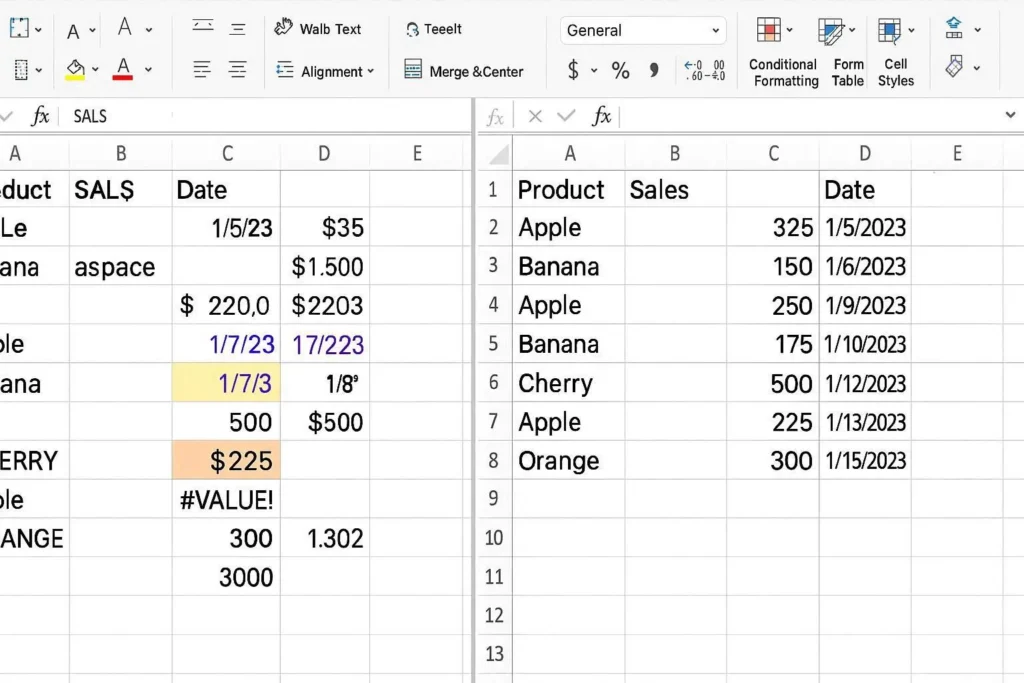
1. Data Cleaning (Your 80% Work Happens Here)
Let’s be real — most data is messy.
Before analysis, you MUST clean it.
What You Need to Learn:
- Removing duplicates
- Fixing date formats
- Handling missing values
- Text cleanup (TRIM, CLEAN)
Example:
Imagine you downloaded sales data and:
- Names have extra spaces
- Dates are in different formats
- Duplicate entries exist
If you don’t fix this → your analysis becomes wrong ❌
Pro Tip:
Use:
- TRIM() → removes extra spaces
- Remove Duplicates tool
- Find & Replace (Ctrl + H)
👉 This step alone separates beginners from professionals.
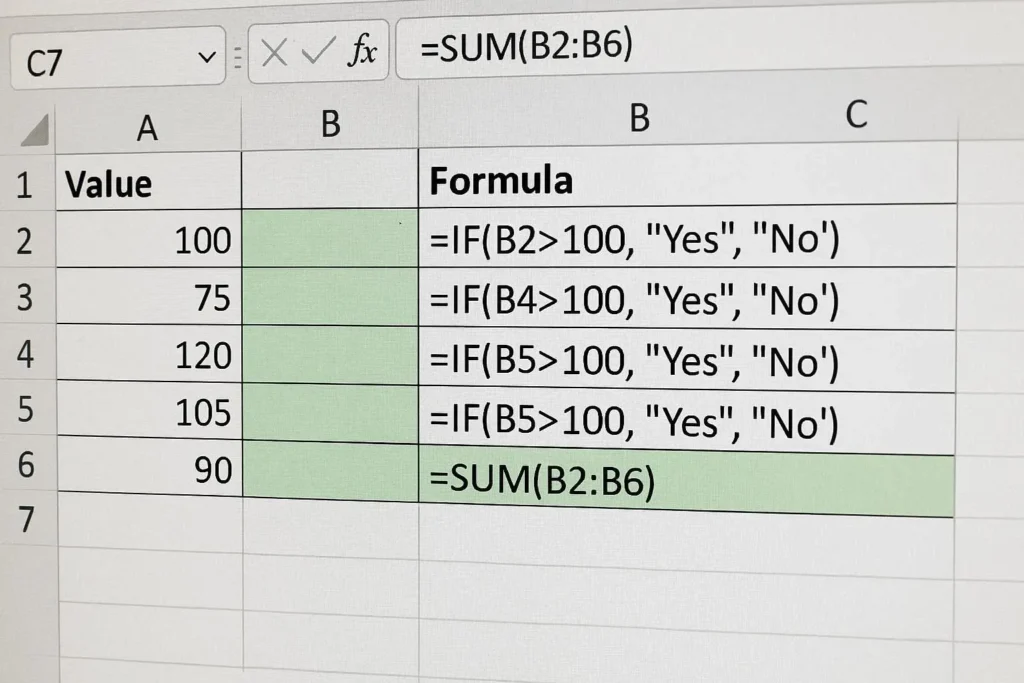
2. Basic Formulas (Your Core Power 💪)
If Excel had a heart, it would be formulas.
Must-Know Formulas:
- SUM() → Add values
- AVERAGE() → Calculate mean
- COUNT() / COUNTA()
- IF() → Logical conditions
Real Example:
=IF(A2>50,"Pass","Fail")
👉 Used in:
- Student results
- Sales targets
- Performance tracking
Why It Matters:
Without formulas, Excel is just a table.
With formulas → it becomes a data analysis machine.
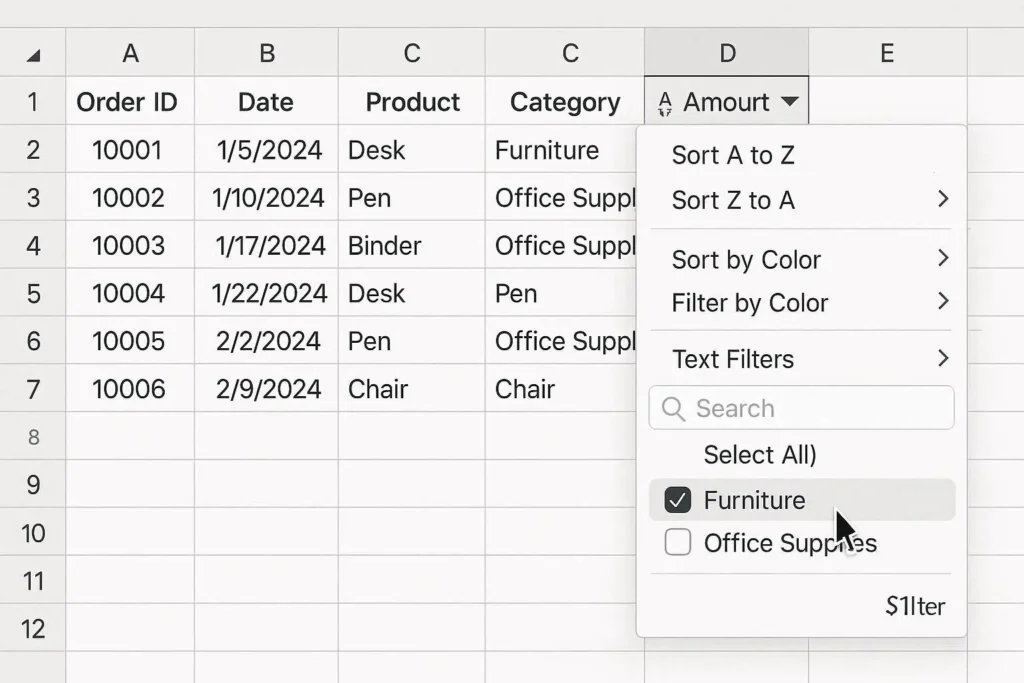
3. Sorting & Filtering (Find Insights Fast)
This is where things start getting interesting.
Sorting:
- Sort by highest sales
- Sort by date
- Sort alphabetically
Filtering:
- Show only specific data
- Remove unwanted values
- Focus on trends
Real-Life Example:
You have 1000 rows of data.
Instead of scrolling like crazy:
👉 Use Filter → instantly see:
- Top customers
- Best-selling products
- Monthly trends
Pro Tip:
Use Custom Filters:
- Greater than
- Less than
- Between values
This saves HOURS of manual work.
4. Pivot Tables (Game Changer 🔥)
Bro, if you learn only ONE advanced thing — make it Pivot Tables.
What is a Pivot Table?
It summarizes large data into meaningful insights.
Example:
You have sales data like:
| Product | City | Sales |
|---|
Pivot Table can instantly show:
- Total sales by city
- Best-selling product
- Monthly performance
Why It’s Powerful:
- No formulas needed
- Drag-and-drop interface
- Instant summaries
Real Insight:
Most freelancers earn money using only Pivot Tables + basic Excel.
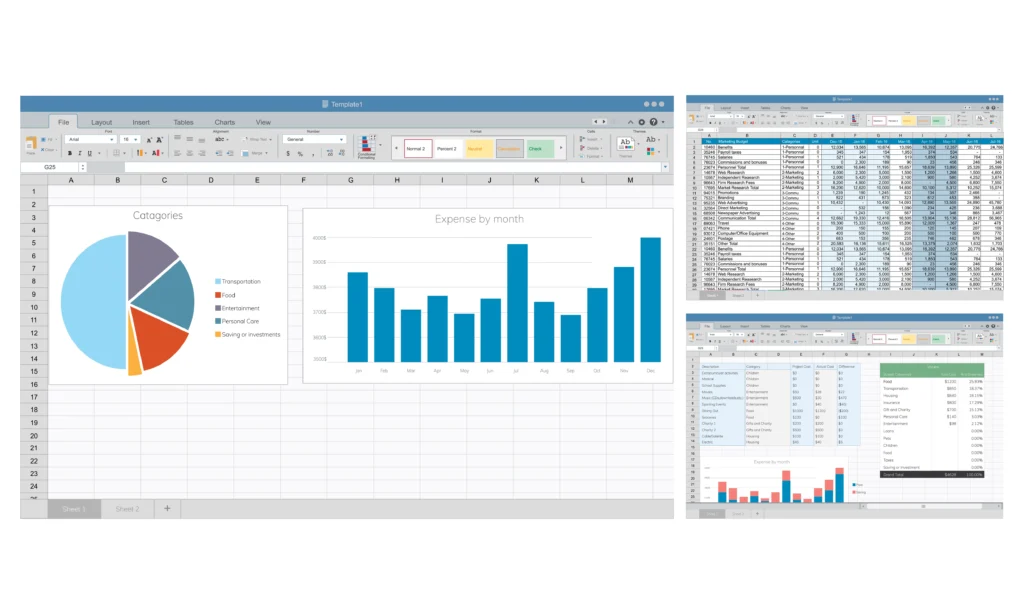
5. Data Visualization (Charts & Graphs)
Numbers alone are boring.
Visualization makes data understandable.
Types of Charts to Learn:
- Bar Chart
- Line Chart
- Pie Chart
Example:
Instead of showing:
👉 100 rows of sales data
Show:
👉 A chart → trends become clear instantly
Best Practice:
- Keep charts simple
- Avoid too many colors
- Focus on clarity
Key Insights (What Most Beginners Don’t Realize)
Here are some real-world truths:
- ✔ 70% of data analysis = cleaning + organizing
- ✔ Pivot Tables can replace complex formulas
- ✔ Simple dashboards impress clients more than complex code
- ✔ Excel skills = fastest way to start freelancing
Visual Summary Table
| Skill | Importance | Difficulty | Use Case |
|---|---|---|---|
| Data Cleaning | ⭐⭐⭐⭐⭐ | Easy | Fix messy data |
| Formulas | ⭐⭐⭐⭐⭐ | Medium | Calculations |
| Sorting/Filtering | ⭐⭐⭐⭐ | Easy | Quick insights |
| Pivot Tables | ⭐⭐⭐⭐⭐ | Medium | Data summaries |
| Charts | ⭐⭐⭐⭐ | Easy | Presentation |
Internal Linking Ideas (For Your Blog SEO)
You can link this post with:
- “How I Became a Data Analyst Using Excel”
- “Best Excel Formulas for Beginners”
- “Excel Tips & Tricks for Freelancers”
External Resources (For Credibility)
You can naturally link keywords like:
- Microsoft Excel official documentation
- Data analysis best practices (Harvard Business Review, etc.)
Example anchor text:
👉 Learn more about Excel functions from Microsoft’s official guide.
Conclusion
Mastering these excel basics for data analysis is not optional — it’s essential.
You don’t need advanced tools right now.
👉 Start with Excel
👉 Build strong fundamentals
👉 Practice daily
Trust me, bro — once you master these 5 basics, your confidence will shoot up like crazy.