Introduction: Why the SUMIFS Formula Matters More Than You Think
If you’ve ever worked with Excel and felt stuck trying to calculate totals based on multiple conditions, you’re not alone. This is exactly where the SUMIFS Formula in Excel becomes a game-changer.
Imagine this: you have a sales sheet with hundreds of rows. You want to know total sales—but only for a specific product, in a specific region, and within a certain date range. Doing this manually is not just time-consuming, it’s almost impossible at scale.
That’s where the SUMIFS formula steps in as one of the most powerful tools in Excel for data analysis, reporting, and decision-making.
In this guide, you’ll learn:
- What SUMIFS actually does (in simple terms)
- How to use it step-by-step
- Real-world examples that make it easy to understand
- Common mistakes (and how to avoid them)
Let’s break it down in a practical way—not just theory.
What is the SUMIFS Formula in Excel?
The SUMIFS formula is used to add values based on multiple conditions.
Simple Definition:
It sums a range of numbers only when all given criteria are met.
Syntax:
SUMIFS(sum_range, criteria_range1, criteria1, criteria_range2, criteria2, ...)Breakdown:
- sum_range → The numbers you want to add
- criteria_range1 → First condition range
- criteria1 → First condition
- criteria_range2 → Second condition range (optional)
- criteria2 → Second condition (optional)
Real-Life Example (Before We Go Technical)
Think of a supermarket:
- You want total sales of “Milk”
- Only in “Rawalpindi”
- Only in “January”
Instead of filtering manually, SUMIFS gives you the answer instantly.
Step-by-Step Tutorial: How to Use SUMIFS Formula
Let’s walk through a practical example.
Sample Data Table


6
Imagine we have this dataset:
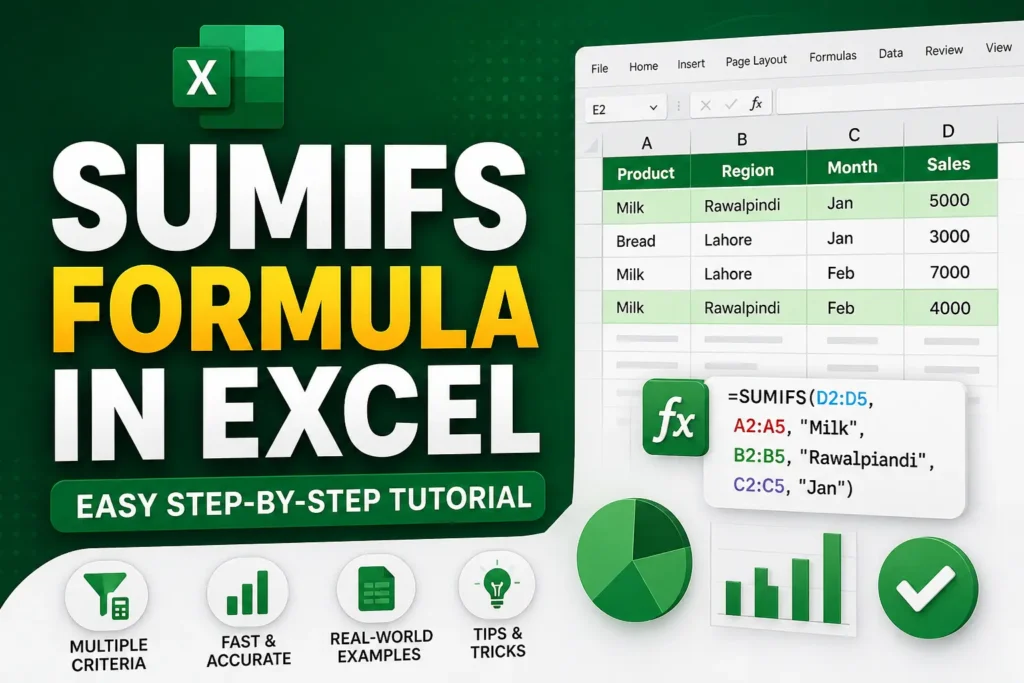
| Product | Region | Month | Sales |
|---|---|---|---|
| Milk | Rawalpindi | Jan | 5000 |
| Bread | Lahore | Jan | 3000 |
| Milk | Lahore | Feb | 7000 |
| Milk | Rawalpindi | Feb | 4000 |
Step 1: Decide What You Want to Calculate
Let’s say:
- Product = Milk
- Region = Rawalpindi
- Month = January
We want total sales for this exact combination.
Step 2: Write the SUMIFS Formula
=SUMIFS(D2:D5, A2:A5, "Milk", B2:B5, "Rawalpindi", C2:C5, "Jan")Explanation:
- D2:D5 → Sales column (what we are adding)
- A2:A5 → Product column
- B2:B5 → Region column
- C2:C5 → Month column
Step 3: Press Enter and Get Results
Excel instantly calculates the correct total.
This is the real power of SUMIFS—speed + accuracy.
How SUMIFS Works (Visual Understanding)


7
Think of Excel doing this internally:
- It checks every row
- Matches all conditions
- Adds only the valid rows
If even one condition fails → that row is ignored.
SUMIF vs SUMIFS: What’s the Difference?
This is where many beginners get confused.
| Feature | SUMIF | SUMIFS |
|---|---|---|
| Conditions | One condition | Multiple conditions |
| Complexity | Simple | Advanced |
| Usage | Basic filtering | Data analysis & reports |
| Flexibility | Limited | Highly flexible |
Key Insight:
If you’re doing serious reporting or dashboards, SUMIFS is the formula you’ll rely on most.
Real-World Use Cases of SUMIFS Formula
Let’s go beyond textbooks and look at practical usage.
1. Business Sales Reports
- Total sales by region
- Monthly performance tracking
2. HR Management
- Salary totals by department
- Attendance-based calculations
3. Finance & Accounting
- Expense tracking by category
- Budget analysis
4. Academic Data
- Student marks filtering
- Performance evaluation
Advanced Example: SUMIFS with Date Range
Now let’s level up.
Suppose you want:
- Sales of Milk
- Between Jan 1 and Jan 31
Formula:
=SUMIFS(D2:D100, A2:A100, "Milk", C2:C100, ">=1-Jan-2026", C2:C100, "<=31-Jan-2026")This is widely used in financial dashboards and reporting systems.
Common Mistakes (And How to Fix Them)
Even experienced users make these errors:
❌ 1. Wrong Range Sizes
All ranges must be equal in size.
❌ 2. Text Spelling Errors
“Milk” ≠ “milk ” (extra space matters!)
❌ 3. Incorrect Date Format
Excel may not recognize text dates properly.
❌ 4. Mixing SUMIF and SUMIFS Logic
Using single-condition thinking inside SUMIFS leads to confusion.
Pro Tips to Master SUMIFS Formula
Here are some insider tricks:
✔ Use Cell References Instead of Text
Instead of:
"Milk"Use:
E1✔ Combine with Pivot Tables
For dynamic dashboards, SUMIFS + Pivot Tables is powerful.
✔ Use Wildcards
*Milk*→ contains MilkM?lk→ flexible matching
SUMIFS in Excel Dashboards


8
Most professional dashboards use SUMIFS behind the scenes to:
- Calculate KPIs
- Update charts dynamically
- Filter business performance
If you understand SUMIFS well, you can build professional-level Excel dashboards.
Why SUMIFS is a Must-Learn Skill in 2026
In today’s data-driven world:
- Companies rely on Excel for reporting
- Data accuracy is critical
- Automation saves hours of work
Learning SUMIFS gives you:
- Faster data analysis
- Better job opportunities
- Strong Excel foundation for advanced tools like Power BI
Conclusion: Mastering SUMIFS Changes the Way You Work
The SUMIFS Formula in Excel is not just another function—it’s a powerful decision-making tool.
Once you understand how it works, you stop “manually filtering data” and start thinking like a data analyst.
Key Takeaways:
- SUMIFS handles multiple conditions easily
- It is essential for business reporting
- It saves time and improves accuracy
- It works best with structured data
Final Call-to-Action
If you found this guide helpful, try practicing SUMIFS with your own dataset today. The more you use it, the more natural it becomes.
And if you want more Excel tutorials like:
- VLOOKUP vs XLOOKUP
- Pivot Tables for beginners
- Excel dashboards from scratch
Stay tuned and keep learning—Excel skills are one of the most powerful tools you can build in your career.